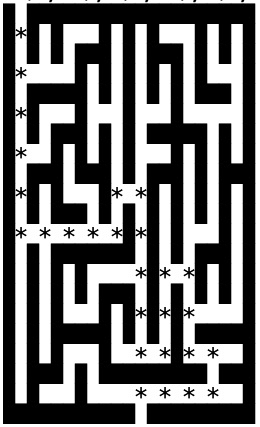
Maze Solution Visualizer
Technology used: Python
My Contribution: Solo (Class Project)

The exercise was to come up with a function that travels through a maze built from lists and add edges to the coordinates.
It would then be fed into a Dijkstra function what found the shortest path. Then I needed to get the coordinates from the shortest path so I could print the shortest path in the maze but also print the solution, a list of coordinates.
What was challenging
Visualizing how the code is travelling through the maze set up. what are the borders and what is maze path. Also it that the edge goes both ways
What I learned
With this problem I found it helpful to work with a very small maze first to get a sense of the problem. Once I understood that, it was pretty easy to scale it up.
def create_graph(self):

    maze_graph = Graph()

    for col in range(self._width):
        for row in range(self._height):
            #                   0         1           2          3
            vertex_data = [str(col), str(col + 1), str(row), str(row + 1)]

            # If there's no h_wall in the way
            if row != self._height - 1 and self._h_walls[col][row] != 1:
                # add_edge with value 1 both ways
                maze_graph.add_edge(f'{vertex_data[0]}-{vertex_data[2]}',
                                    f'{vertex_data[0]}-{vertex_data[3]}',
                                    1)
                maze_graph.add_edge(f'{vertex_data[0]}-{vertex_data[3]}',
                                    f'{vertex_data[0]}-{vertex_data[2]}',
                                    1)

            # If there's no v_wall in the way
            if col != self._width - 1 and self._v_walls[col][row] != 1:
                # add_edge with value 1 both ways
                maze_graph.add_edge(f'{vertex_data[0]}-{vertex_data[2]}',
                                    f'{vertex_data[1]}-{vertex_data[2]}',
                                    1)
                maze_graph.add_edge(f'{vertex_data[1]}-{vertex_data[2]}',
                                    f'{vertex_data[0]}-{vertex_data[2]}',
                                    1)

[(5, 0), (6, 0), (7, 0), (8, 0), (8, 1), (7, 1), (7, 2), (7, 3), (6, 3),
(6, 2), (6, 1), (5, 1), (5, 2), (5, 3), (5, 4), (5, 5), (4, 5), (4, 4),
(3, 4), (2, 4), (1, 4), (0, 4), (0, 5), (0, 6), (0, 7), (0, 8), (0, 9)]